Fiddler In Action - Part 1
[Update - 2012-04-25] I covered these features in my presentation at DDD Brisbane. You may find the slides, the video and more details here
Fiddler is a very popular tool for web debugging. It has been out for a few years now and it has millions of users. In this article I will cover some of the basic features of Fiddler and in a future article I will build on this foundation and talk about more advanced features.
It is worth mentioning that everything I am writing here (plus a lot of things I cannot fit into this blog) can be found on the Fiddler website.
What is Fiddler?
Fiddler is a Web Debugging Proxy which logs all HTTP(S) traffic between your computer and the Internet. Fiddler allows you to inspect traffic, set breakpoints, and “fiddle” with incoming or outgoing data. Fiddler includes a powerful event-based scripting subsystem, and can be extended using any .NET language.
Fiddler is freeware and can debug traffic from virtually any application that supports a proxy, including Internet Explorer, Google Chrome, Apple Safari, Mozilla Firefox, Opera, and thousands more. You can also debug traffic from popular devices like Windows Phone, iPod/iPad, and others.
You can get the application from the Fiddler’s website along with tones of documentation, tutorial videos and so on. On the Fiddler’s website there is also a Fiddler Extension repository that lists major Fiddler’s extensions.
How does it work?
Fiddler sits between your http client and http server listening on a port for http(s) traffic.
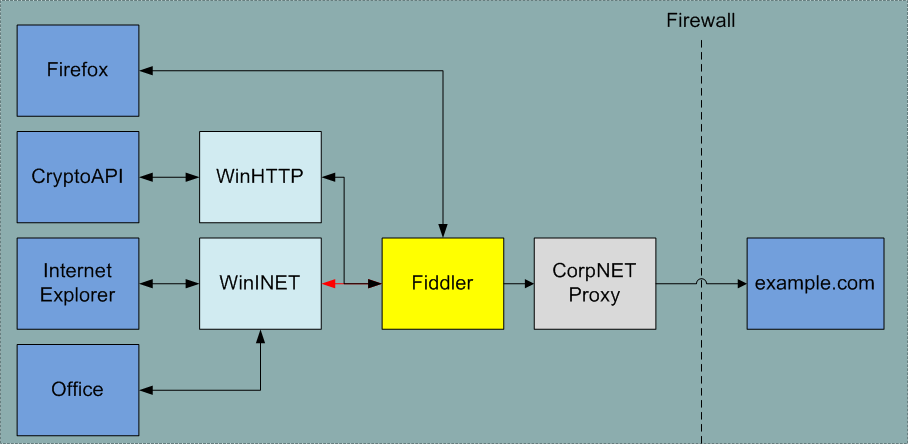
Figure 1 - Fiddler Web Proxy
WinINet (The Windows Internet) enables applications to interact with FTP, and HTTP protocols to access Internet resources.
I am sure you are familiar with ‘LAN Settings’ under the ‘Connections’ tab of Internet (Explorer) Options:
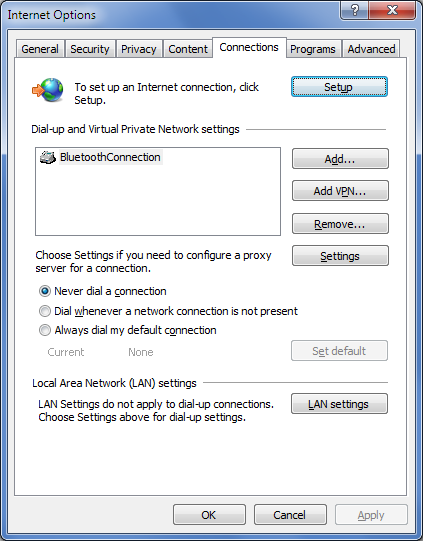
Figure 2 - ‘Connections’ tab
The Proxy Settings under ‘LAN Settings’ is your computer’s proxy settings which is kind of like the UI for WinINet.
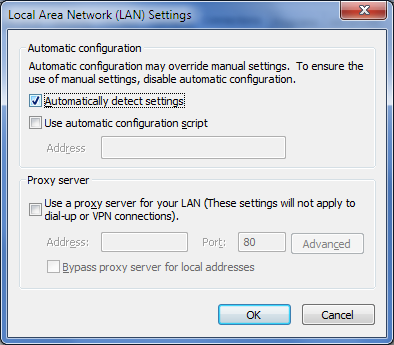
Figure 3 - WinINet Proxy Settings
When you start up Fiddler it saves your current proxy settings and changes it so it can work as a proxy for all your http traffic:
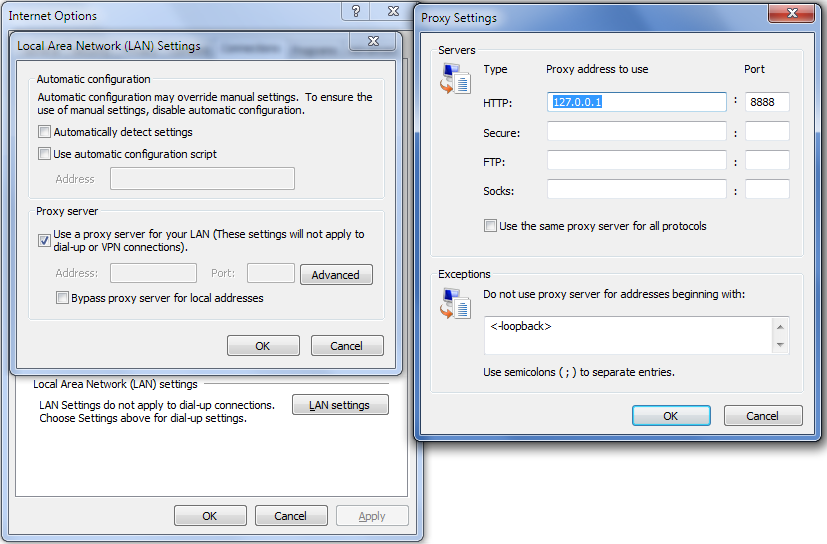
Figure 4 - WinINet Proxy Settings changes on Fiddler start up
And of course it sets back the proxy to your original settings when you close the Fiddler or stop it. You can start and stop Fiddler capturing through File -> Capture Traffic, or using F12, or using start and stop QuickExec commands.
Fiddler is a Web Proxy; so it does not really care where the traffic is coming from and where it is going to. This means that you can use Fiddler on pretty much any application or device that can talk to a proxy:
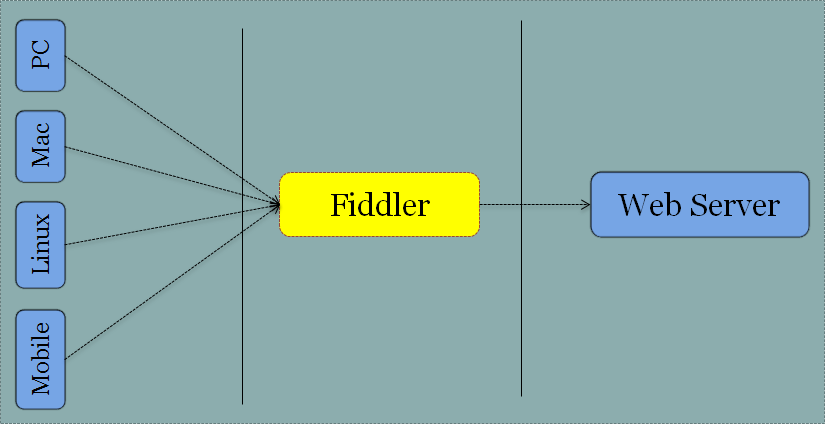
Figure 5 - If you can use an HTTP Proxy you can use Fiddler
Similar Tools
Fiddler is not the only tool that works as a proxy or provides these capabilities. Following is the list of some of the more or less similar tools:
- WireShark: a free and open-source packet analyzer. It is used for network troubleshooting, analysis, software and communications protocol development, and education.
- Microsoft Network Monitor (AKA NetMon): a packet analyzer. It enables capturing, viewing, and analyzing network data and deciphering network protocols. It can be used to troubleshoot network problems and applications on the network.
- Browser Plugins (they are not proxy)
- HttpWatch for IE and FireFox: an integrated HTTP sniffer for IE and Firefox that provides new insights into how your website loads and performs.
- FireBug for FireFox: a web development tool that allows the debugging, editing, and monitoring of any website’s CSS, HTML, DOM, and JavaScript, and provides other Web development tools.
- Chrome developer tools (Ctrl+shift+I)
- FireBug Lite for Chrome: provides the rich visual representation we are used to see in Firebug when it comes to HTML elements, DOM elements, and Box Model shading. It provides also some cool features like inspecting HTML elemements with your mouse, and live editing CSS properties.
- IE Dev Tools (F12): IE9 currently provides some of the Fiddler’s feature and is going to provide even more - I guess because Eric Lawrence, the author of Fiddler, is a PM on IE team.
WireShark and NetMon are proxies which are more or less similar to Fiddler in nature; however, while Fiddler intercepts the traffic on the Application Layer, WireShark and NetMon intercept the traffic on much lower level and they are not limited to HTTP. This makes them awesome choices when it comes to low level debugging of network issues or monitoring protocols other than http; however, they do not display the traffic in an as easily understandable form as Fiddler.
Browser plugins are, however, different from proxies in nature. Firstly they run in the browser and as such can only intercept browser traffic. All the browser plugins I know limit the traffic monitoring to the session/tab they are running on (which makes sense). Proxies however run as a separate process and intercept traffic regardless of where it is coming from.
The other difference worth pointing out is that browsers serve (valid/current) cached contents locally without hitting the network. For example if your website requires a CSS file that has been cached on the computer from a previous session and is still valid, when you browse to the website again, the browser is going to serve the css locally. This means that the browser plugin is going to see the content served from the cache while proxies will not see the request and the traffic because browser does not make any request.
Let’s get started with Fiddler
Fiddler is a Windows Forms application written in .Net 2. The UI (at V2.3.5.2) looks like:
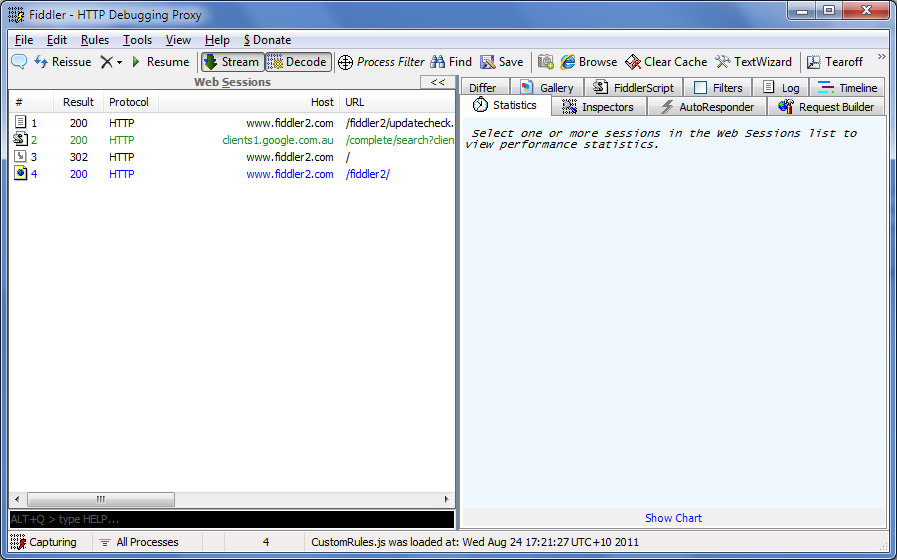
Figure 6 - Fiddler UI
We are going to go through the UI and see what each tab/menu/feature does. Well, I do this for the most used/useful features and this by no means is an exhaustive reference. For more information please refer to Fiddler web site where Eric provides a lot of information on every single feature.
Web Sessions
Web Sessions pane is where the traffic is displayed as it is captured:
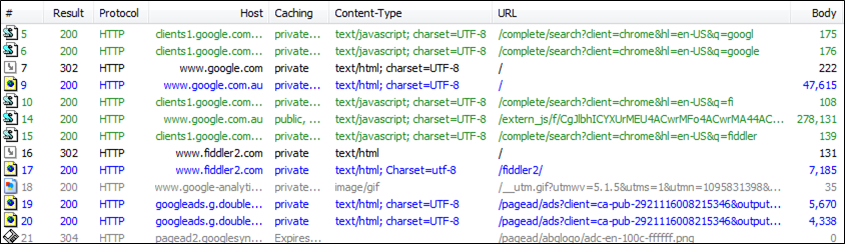
Figure 7 - Web Sessions
Directly copied from Fiddler website: Certain key information is available in this list, including:
- # - An ID# of the request generated by Fiddler for your convenience
- Result - The Result code from the HTTP Response
- Protocol - The Protocol (HTTP/HTTPS/FTP) used by this session
- Host - The hostname of the server to which the request was sent
- URL - The path and file requested from the server
- Body - The number of bytes in the Response body
- Caching - Values from the Response’s Expires or Cache-Control headers
- Process - The local Windows Process from which the traffic originated
- Content-Type - The Content-Type header from the Response
- Custom - A text field you can set via scripting
- Comments - A text field you can set from scripting or the session’s context menu
The icons on the left hand side next to the ID give you more visual information about the session:
![]()
Figure 8 - Icons in the Web Sessions
Traffic Comparison
One little known awesome feature of Web Sessions is the ability to compare two sessions. To compare two sessions select them in the Web Sessions pane, right click and choose ‘Compare’ item from the menu.
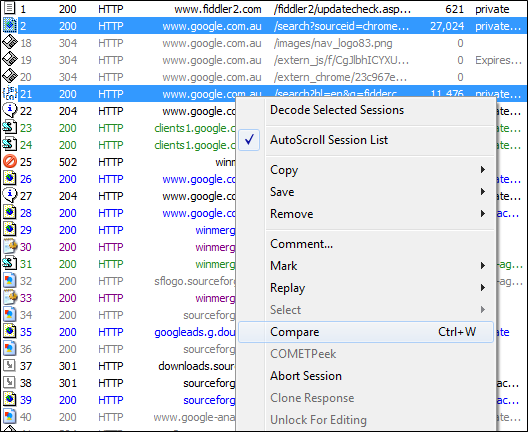
Figure 9 - Compare sessions menu
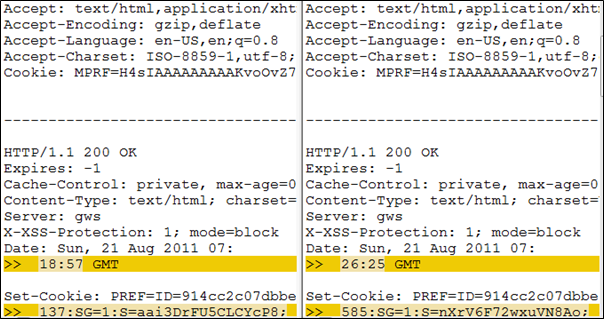
Figure 10 - Compare sessions example
By default Fiddler uses WinDiff as diff tool; but you can change this in registry:
- Open Registry, go to HKEY_CURRENT_USER\Software\Microsoft\Fiddler2
- Add a new String Value called CompareTool and set the value to the path of your favorite Diff tool (e.g. “C:\Program Files\Beyond Compare 3\BCompare.exe”)
- Restart Fiddler
Statistics
The first tab on the right pane is Statistics which shows you some info about the selected session. It is most useful when used on several sessions:
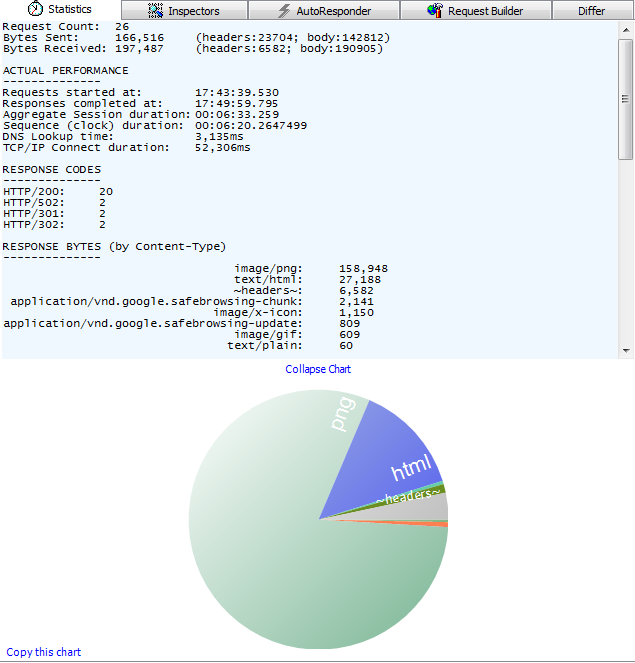
Figure 11 - Statistics tab
Is not that awesome?! So it is telling me that I have selected 26 requests, where total bytes sent and received are 166K and 197K (with more info about the header and body size), it provides a summary on received status codes and MIME types. And then there is the nice chart on the bottom.
Inspectors
Inspectors allow you to visualize requests and responses in meaningful ways. There are heaps of out of the box inspectors and you can write your own if you need to.
When you double click on a session fiddler takes you to the Inspectors tab for that session. It also detects what the most relevant request and response inspectors are and chooses that for you. For example if you double click on a JSON session, Fiddler takes you to the JSON tab.
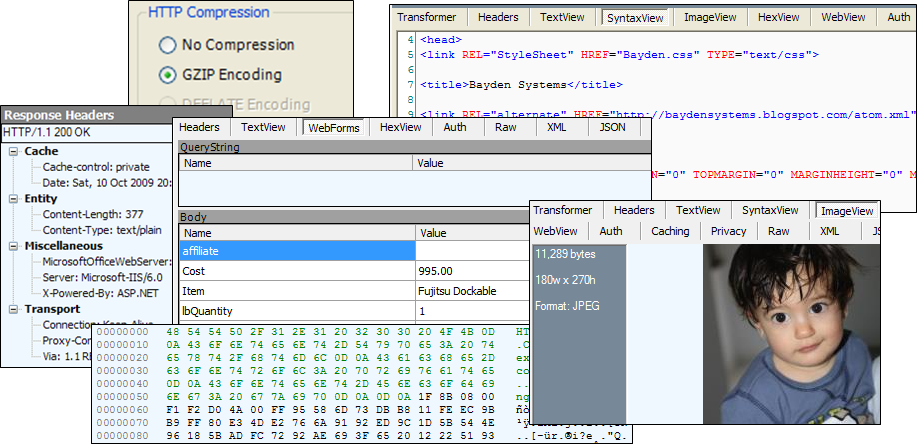
Figure 12 - Inspectors
The little boy is my son and that subtle smile on his face tells me he is about to do something naughty - perhaps giving a visit to the China cupboard!
There are many inspectors and I could write a 30 page article about it; but it is much easier to understand if you run Fiddler and start double clicking on sessions.
HTTPS Traffic Decryption
Fiddler can decipher HTTPS traffic. This scares some of the guys at security/I.T. department; but this is nothing to worry about. It can only do so for the traffic going through it and by your permission.
By default Fiddler does not decipher HTTPS traffic and you should explicitly ask it to do so. In order to activate HTTPS traffic decryption:
- Go to Tools -> Fiddler Options -> HTTPS tab
- Tick Capture HTTPS CONNECTS and Decrypt HTTPS traffic checkboxes.
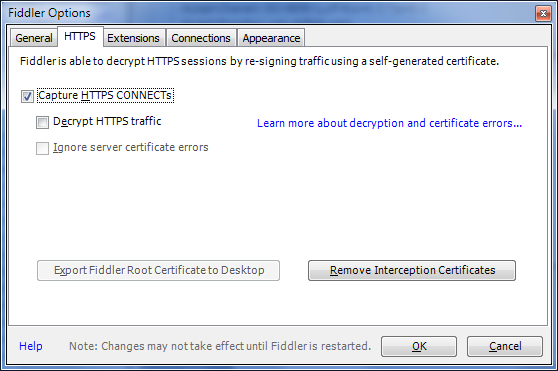
Figure 13 - Fiddler Options - HTTPS tab
After ticking the second checkbox you get an alarming pop up message:
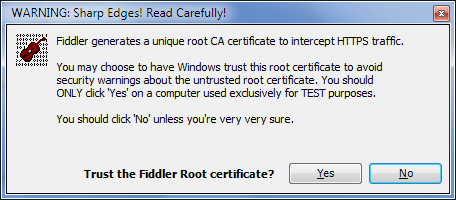
Figure 14 - Installing Fiddler Certificate to avoid warnings
Clicking yes on that dialog brings up a second warning, this time by Windows.
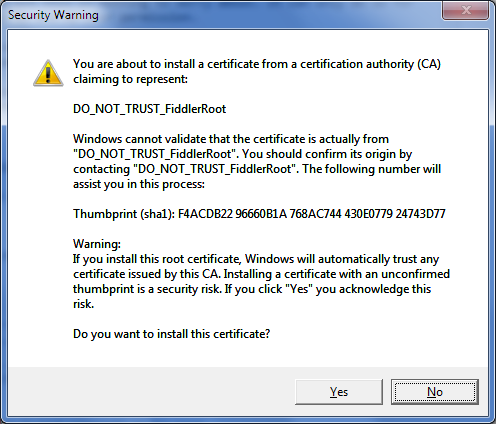
Figure 15 - Windows Security Warning about unverified certificate
Clicking yes on this box installs Fiddler’s certificate in your Personal store:
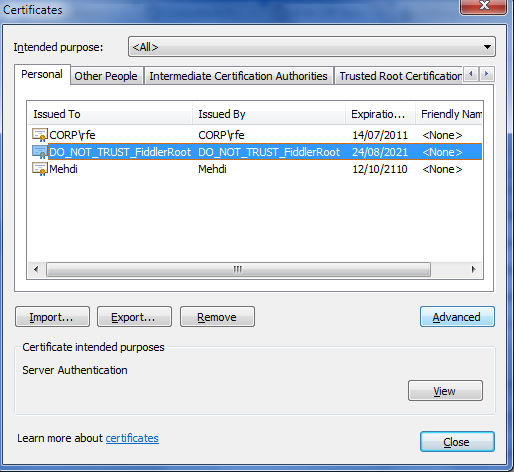
Figure 16 - Fiddler certificate installed in your personal store
Fiddler uses a hacking technique called Man-In-The-Middle Attack to decrypt HTTPS traffic:
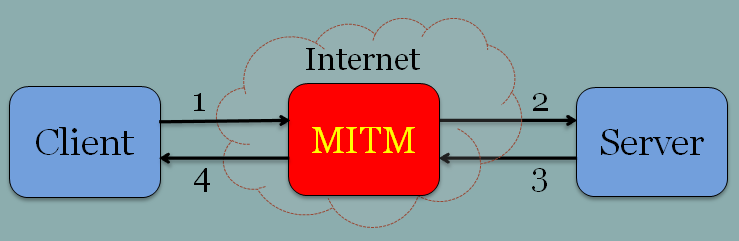
Figure 17 - Man In The Middle Attack
- The client thinks it is talking to the server while it is talking to the man-in-the-middle (MITM) and it uses the MITM’s certificate for SSL.
- MITM then receives client’s request and potentially modifies it and sends it to the server using the server’s certificate.
- Server receives the request thinking it came from the client, does the processing and returns the response to the MITM thinking it is the client.
- MITM receives the response and optionally modifies it and returns it to the client.
So while the client and server are unaware of MITM, the whole traffic has been monitored and perhaps modified. Fiddler does pretty much the same thing except that you know it is sitting in the middle.
Summary
In this article we saw some of the basic features of Fiddler. In summary this is what we covered:
- Fiddler is a Web Debugging Proxy
- It allows you to watch http traffic using Web Sessions and compare two sessions
- It shows you statistics about the selected sessions
- You can inspect requests and responses using Inspectors
- It can decrypt https traffic using the Man-In-The-Middle attack
Soon to come is the next post about more advanced features of Fiddler. Stay tuned.
Hope it helps.